> ## Documentation Index
> Fetch the complete documentation index at: https://docs.hoppscotch.io/llms.txt
> Use this file to discover all available pages before exploring further.
# Set Up OpenTelemetry Stack with Docker
> Set up the OpenTelemetry observability stack with Docker for Hoppscotch Enterprise. Configure collectors, Jaeger, Grafana, and Prometheus.
This guide will help you set up the **OpenTelemetry Collector** on your own server and connect it with **Hoppscotch**.
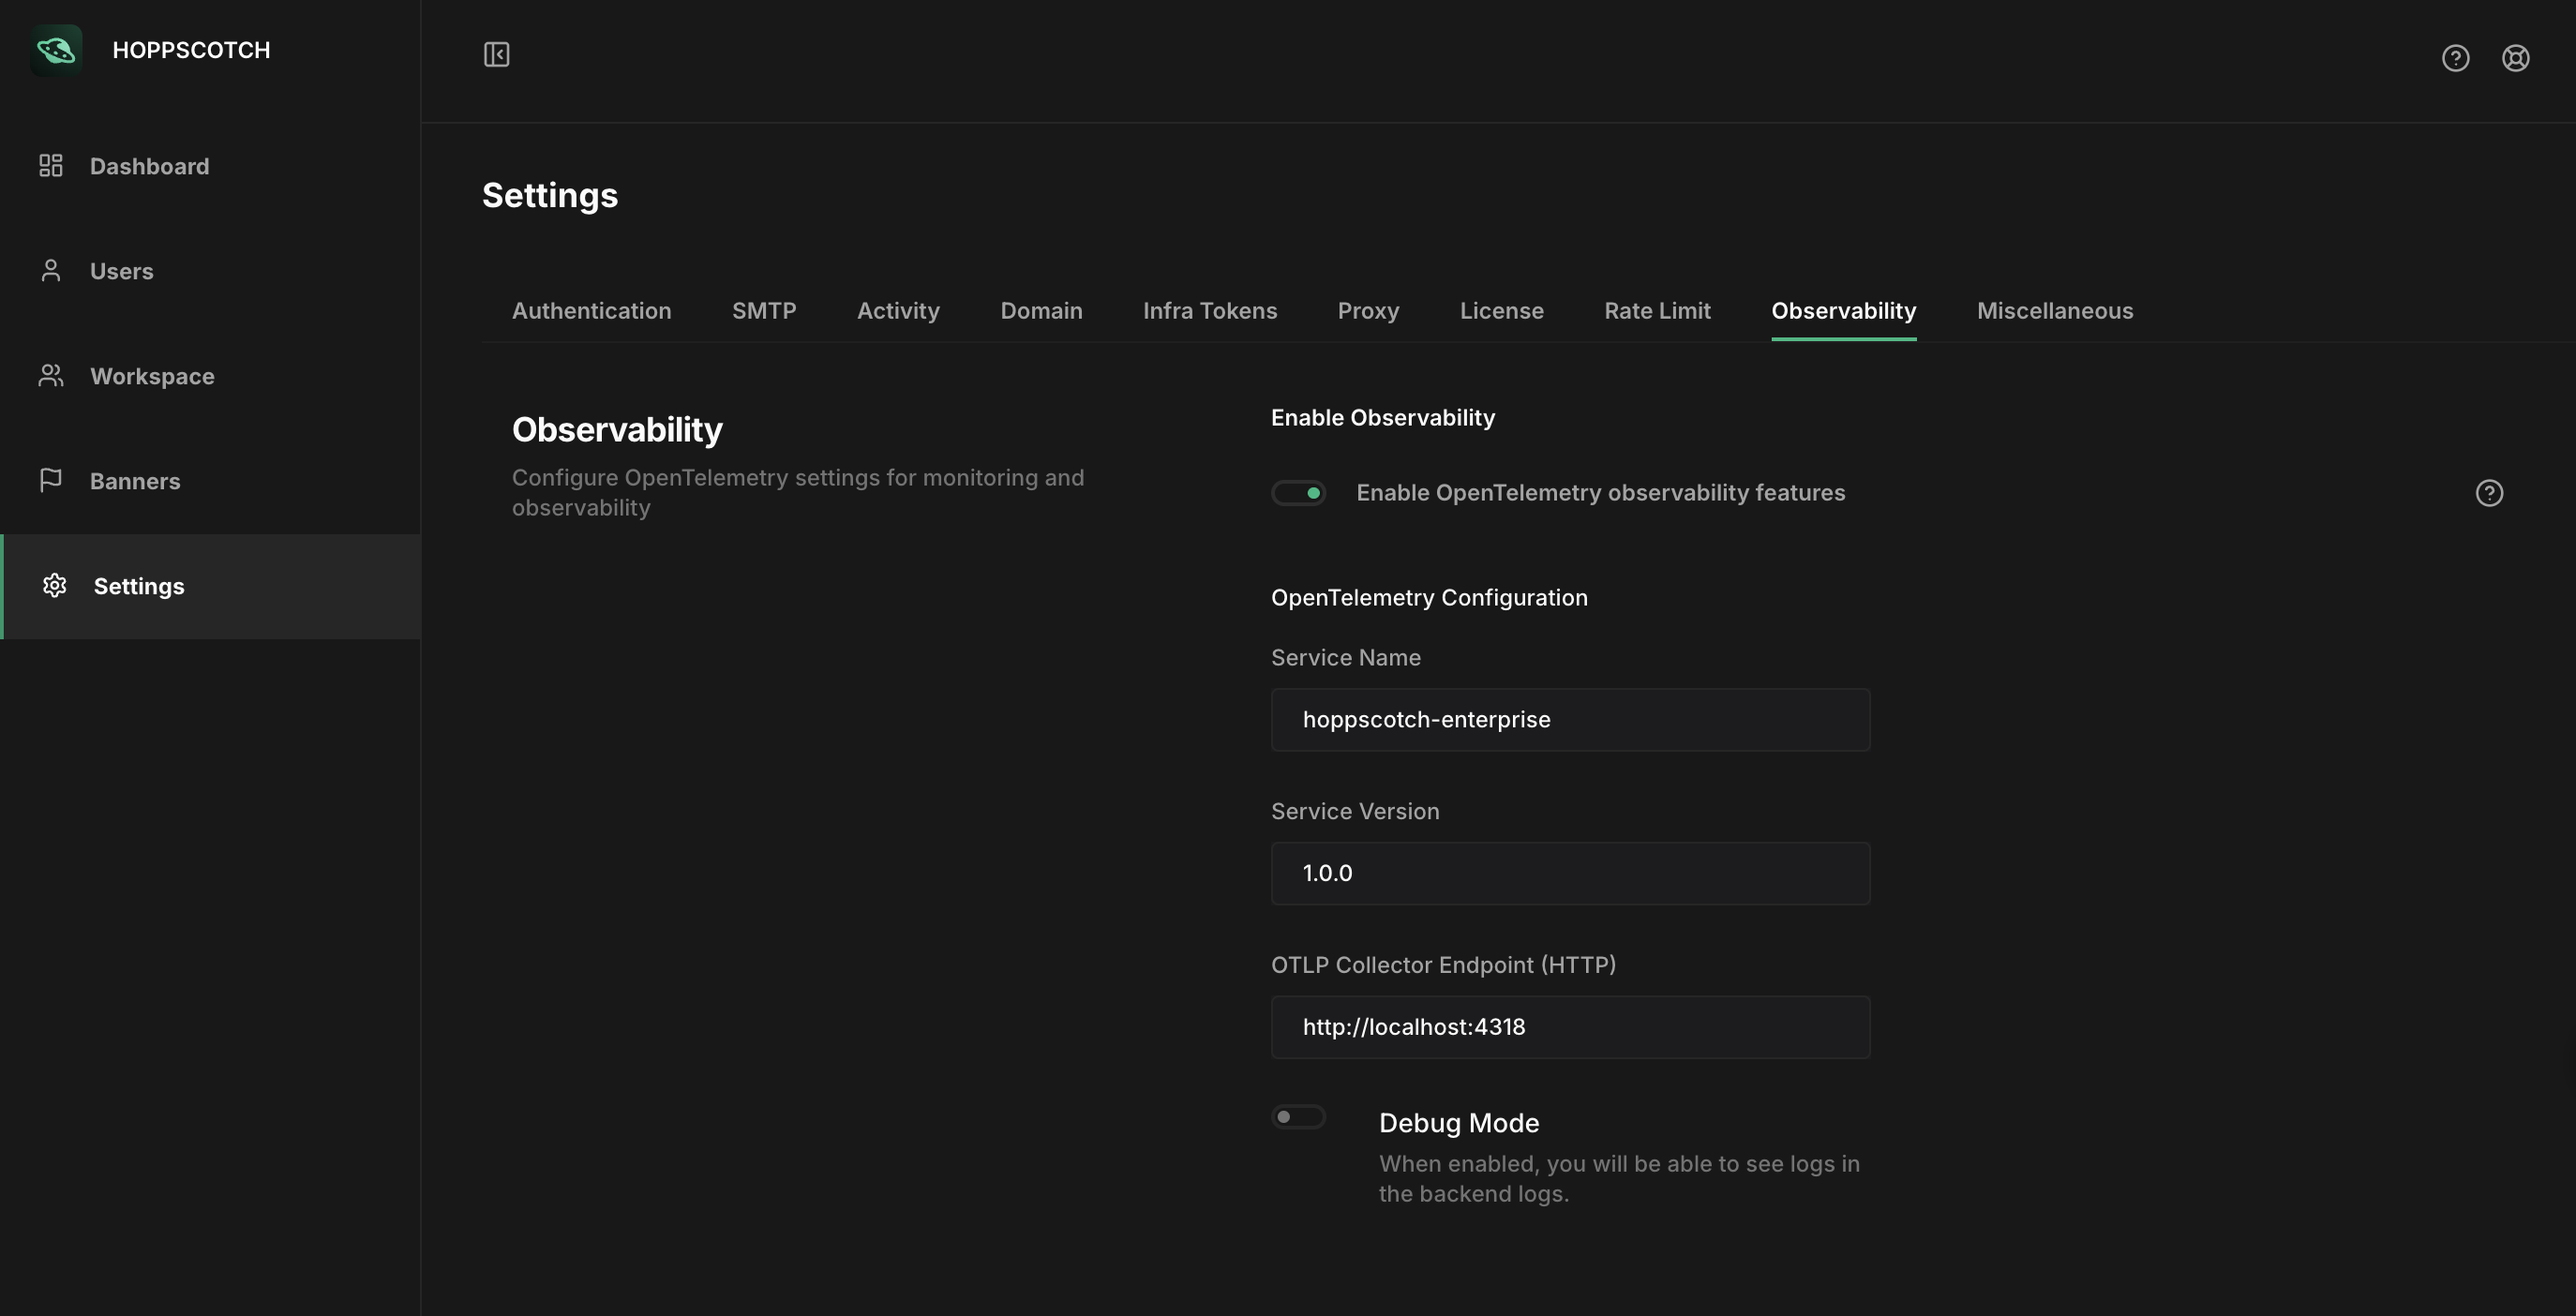
Hoppscotch will send telemetry data (traces and metrics) to your **OpenTelemetry Collector** instance. From the **Hoppscotch Admin Dashboard**, you can easily configure the connection to your deployed Collector.
 Once connected, you can integrate with observability tools such as Jaeger (for traces), Prometheus (for metrics), and Grafana (for dashboards).
# Architecture Overview
1. **Hoppscotch** sends telemetry data to your **OpenTelemetry Collector**.
2. The **Collector** processes this data and exports it to your preferred backends:
* Jaeger (traces)
* Prometheus (metrics)
* Grafana (visualizations, via Prometheus)
3. You can also enable debugging by exporting logs directly to the console.
Create a configuration file named `otel-collector-config.yaml`:
```bash theme={null}
receivers:
otlp:
protocols:
grpc:
endpoint: 0.0.0.0:4317
http:
endpoint: 0.0.0.0:4318
processors:
batch:
timeout: 1s
send_batch_size: 1024
memory_limiter:
limit_mib: 512
check_interval: 1s
exporters:
# Export traces to Jaeger via OTLP (using gRPC)
otlp/jaeger:
endpoint: jaeger:4317
tls:
insecure: true
# Export metrics to Prometheus
prometheus:
endpoint: "0.0.0.0:8889"
# Debug exporter - logs telemetry data to console
debug:
verbosity: detailed
sampling_initial: 5
sampling_thereafter: 200
service:
pipelines:
traces:
receivers: [otlp]
processors: [memory_limiter, batch]
exporters: [otlp/jaeger, debug]
metrics:
receivers: [otlp]
processors: [memory_limiter, batch]
exporters: [prometheus, debug]
```
Create a file named `prometheus.yml`:
```bash theme={null}
global:
scrape_interval: 5s
evaluation_interval: 5s
scrape_configs:
- job_name: "otel-collector"
static_configs:
- targets: ["otel-collector:8889"]
scrape_interval: 5s
- job_name: "prometheus"
static_configs:
- targets: ["localhost:9090"]
```
Provision Grafana with Prometheus as a data source.
Create `grafana/provisioning/datasources.yaml`:
```bash theme={null}
apiVersion: 1
datasources:
- name: Prometheus
type: prometheus
access: proxy
url: http://prometheus:9090
isDefault: true
```
Use the following `docker-compose.yaml` to deploy everything:
```bash theme={null}
version: "3.8"
services:
# OpenTelemetry Collector
otel-collector:
image: otel/opentelemetry-collector-contrib:0.92.0
container_name: otel-collector
command: ["--config=/etc/otel-collector-config.yaml"]
volumes:
- ./otel-collector-config.yaml:/etc/otel-collector-config.yaml
ports:
- "4317:4317" # OTLP gRPC receiver
- "4318:4318" # OTLP HTTP receiver
- "8889:8889" # Prometheus metrics
depends_on:
- jaeger
- prometheus
networks:
- observability
# Jaeger (for traces)
jaeger:
image: jaegertracing/all-in-one:latest
container_name: jaeger
ports:
- "16686:16686" # Jaeger UI
environment:
- COLLECTOR_OTLP_ENABLED=true
networks:
- observability
# Prometheus (for metrics)
prometheus:
image: prom/prometheus:latest
container_name: prometheus
ports:
- "9090:9090"
volumes:
- ./prometheus.yml:/etc/prometheus/prometheus.yml
networks:
- observability
# Grafana (for dashboards)
grafana:
image: grafana/grafana:latest
container_name: grafana
ports:
- "3000:3000"
environment:
- GF_SECURITY_ADMIN_PASSWORD=***** # replace with a secure password
volumes:
- grafana-storage:/var/lib/grafana
- ./grafana/provisioning:/etc/grafana/provisioning
networks:
- observability
volumes:
grafana-storage:
networks:
observability:
driver: bridge
```
Start the observability stack:
```bash theme={null}
docker-compose up -d
```
* **Jaeger UI**: [http://localhost:16686](http://localhost:16686/)
* **Prometheus**: [http://localhost:9090](http://localhost:9090/)
* **Grafana**: [http://localhost:3000](http://localhost:3000/)
From the **Hoppscotch Admin Dashboard**, configure the OpenTelemetry Collector endpoint (**HTTP**).
Once connected, Hoppscotch will begin sending telemetry data, which you can observe in **Jaeger**, **Prometheus**, and **Grafana**.
Once connected, you can integrate with observability tools such as Jaeger (for traces), Prometheus (for metrics), and Grafana (for dashboards).
# Architecture Overview
1. **Hoppscotch** sends telemetry data to your **OpenTelemetry Collector**.
2. The **Collector** processes this data and exports it to your preferred backends:
* Jaeger (traces)
* Prometheus (metrics)
* Grafana (visualizations, via Prometheus)
3. You can also enable debugging by exporting logs directly to the console.
Create a configuration file named `otel-collector-config.yaml`:
```bash theme={null}
receivers:
otlp:
protocols:
grpc:
endpoint: 0.0.0.0:4317
http:
endpoint: 0.0.0.0:4318
processors:
batch:
timeout: 1s
send_batch_size: 1024
memory_limiter:
limit_mib: 512
check_interval: 1s
exporters:
# Export traces to Jaeger via OTLP (using gRPC)
otlp/jaeger:
endpoint: jaeger:4317
tls:
insecure: true
# Export metrics to Prometheus
prometheus:
endpoint: "0.0.0.0:8889"
# Debug exporter - logs telemetry data to console
debug:
verbosity: detailed
sampling_initial: 5
sampling_thereafter: 200
service:
pipelines:
traces:
receivers: [otlp]
processors: [memory_limiter, batch]
exporters: [otlp/jaeger, debug]
metrics:
receivers: [otlp]
processors: [memory_limiter, batch]
exporters: [prometheus, debug]
```
Create a file named `prometheus.yml`:
```bash theme={null}
global:
scrape_interval: 5s
evaluation_interval: 5s
scrape_configs:
- job_name: "otel-collector"
static_configs:
- targets: ["otel-collector:8889"]
scrape_interval: 5s
- job_name: "prometheus"
static_configs:
- targets: ["localhost:9090"]
```
Provision Grafana with Prometheus as a data source.
Create `grafana/provisioning/datasources.yaml`:
```bash theme={null}
apiVersion: 1
datasources:
- name: Prometheus
type: prometheus
access: proxy
url: http://prometheus:9090
isDefault: true
```
Use the following `docker-compose.yaml` to deploy everything:
```bash theme={null}
version: "3.8"
services:
# OpenTelemetry Collector
otel-collector:
image: otel/opentelemetry-collector-contrib:0.92.0
container_name: otel-collector
command: ["--config=/etc/otel-collector-config.yaml"]
volumes:
- ./otel-collector-config.yaml:/etc/otel-collector-config.yaml
ports:
- "4317:4317" # OTLP gRPC receiver
- "4318:4318" # OTLP HTTP receiver
- "8889:8889" # Prometheus metrics
depends_on:
- jaeger
- prometheus
networks:
- observability
# Jaeger (for traces)
jaeger:
image: jaegertracing/all-in-one:latest
container_name: jaeger
ports:
- "16686:16686" # Jaeger UI
environment:
- COLLECTOR_OTLP_ENABLED=true
networks:
- observability
# Prometheus (for metrics)
prometheus:
image: prom/prometheus:latest
container_name: prometheus
ports:
- "9090:9090"
volumes:
- ./prometheus.yml:/etc/prometheus/prometheus.yml
networks:
- observability
# Grafana (for dashboards)
grafana:
image: grafana/grafana:latest
container_name: grafana
ports:
- "3000:3000"
environment:
- GF_SECURITY_ADMIN_PASSWORD=***** # replace with a secure password
volumes:
- grafana-storage:/var/lib/grafana
- ./grafana/provisioning:/etc/grafana/provisioning
networks:
- observability
volumes:
grafana-storage:
networks:
observability:
driver: bridge
```
Start the observability stack:
```bash theme={null}
docker-compose up -d
```
* **Jaeger UI**: [http://localhost:16686](http://localhost:16686/)
* **Prometheus**: [http://localhost:9090](http://localhost:9090/)
* **Grafana**: [http://localhost:3000](http://localhost:3000/)
From the **Hoppscotch Admin Dashboard**, configure the OpenTelemetry Collector endpoint (**HTTP**).
Once connected, Hoppscotch will begin sending telemetry data, which you can observe in **Jaeger**, **Prometheus**, and **Grafana**.