Architecture Overview
- Hoppscotch sends telemetry data to your OpenTelemetry Collector.
- The Collector processes this data and exports it to your preferred backends:
- Jaeger (traces)
- Prometheus (metrics)
- Grafana (visualizations, via Prometheus)
- You can also enable debugging by exporting logs directly to the console.
Step 1: Configure OpenTelemetry Collector
Step 1: Configure OpenTelemetry Collector
Create a configuration file named
otel-collector-config.yaml:Step 2: Configure Prometheus
Step 2: Configure Prometheus
Create a file named
prometheus.yml:Step 3: Configure Grafana Data Source
Step 3: Configure Grafana Data Source
Provision Grafana with Prometheus as a data source.Create
grafana/provisioning/datasources.yaml:Step 4: Docker Compose Setup
Step 4: Docker Compose Setup
Use the following
docker-compose.yaml to deploy everything:Step 5: Run the Stack
Step 5: Run the Stack
Start the observability stack:
- Jaeger UI: http://localhost:16686
- Prometheus: http://localhost:9090
- Grafana: http://localhost:3000
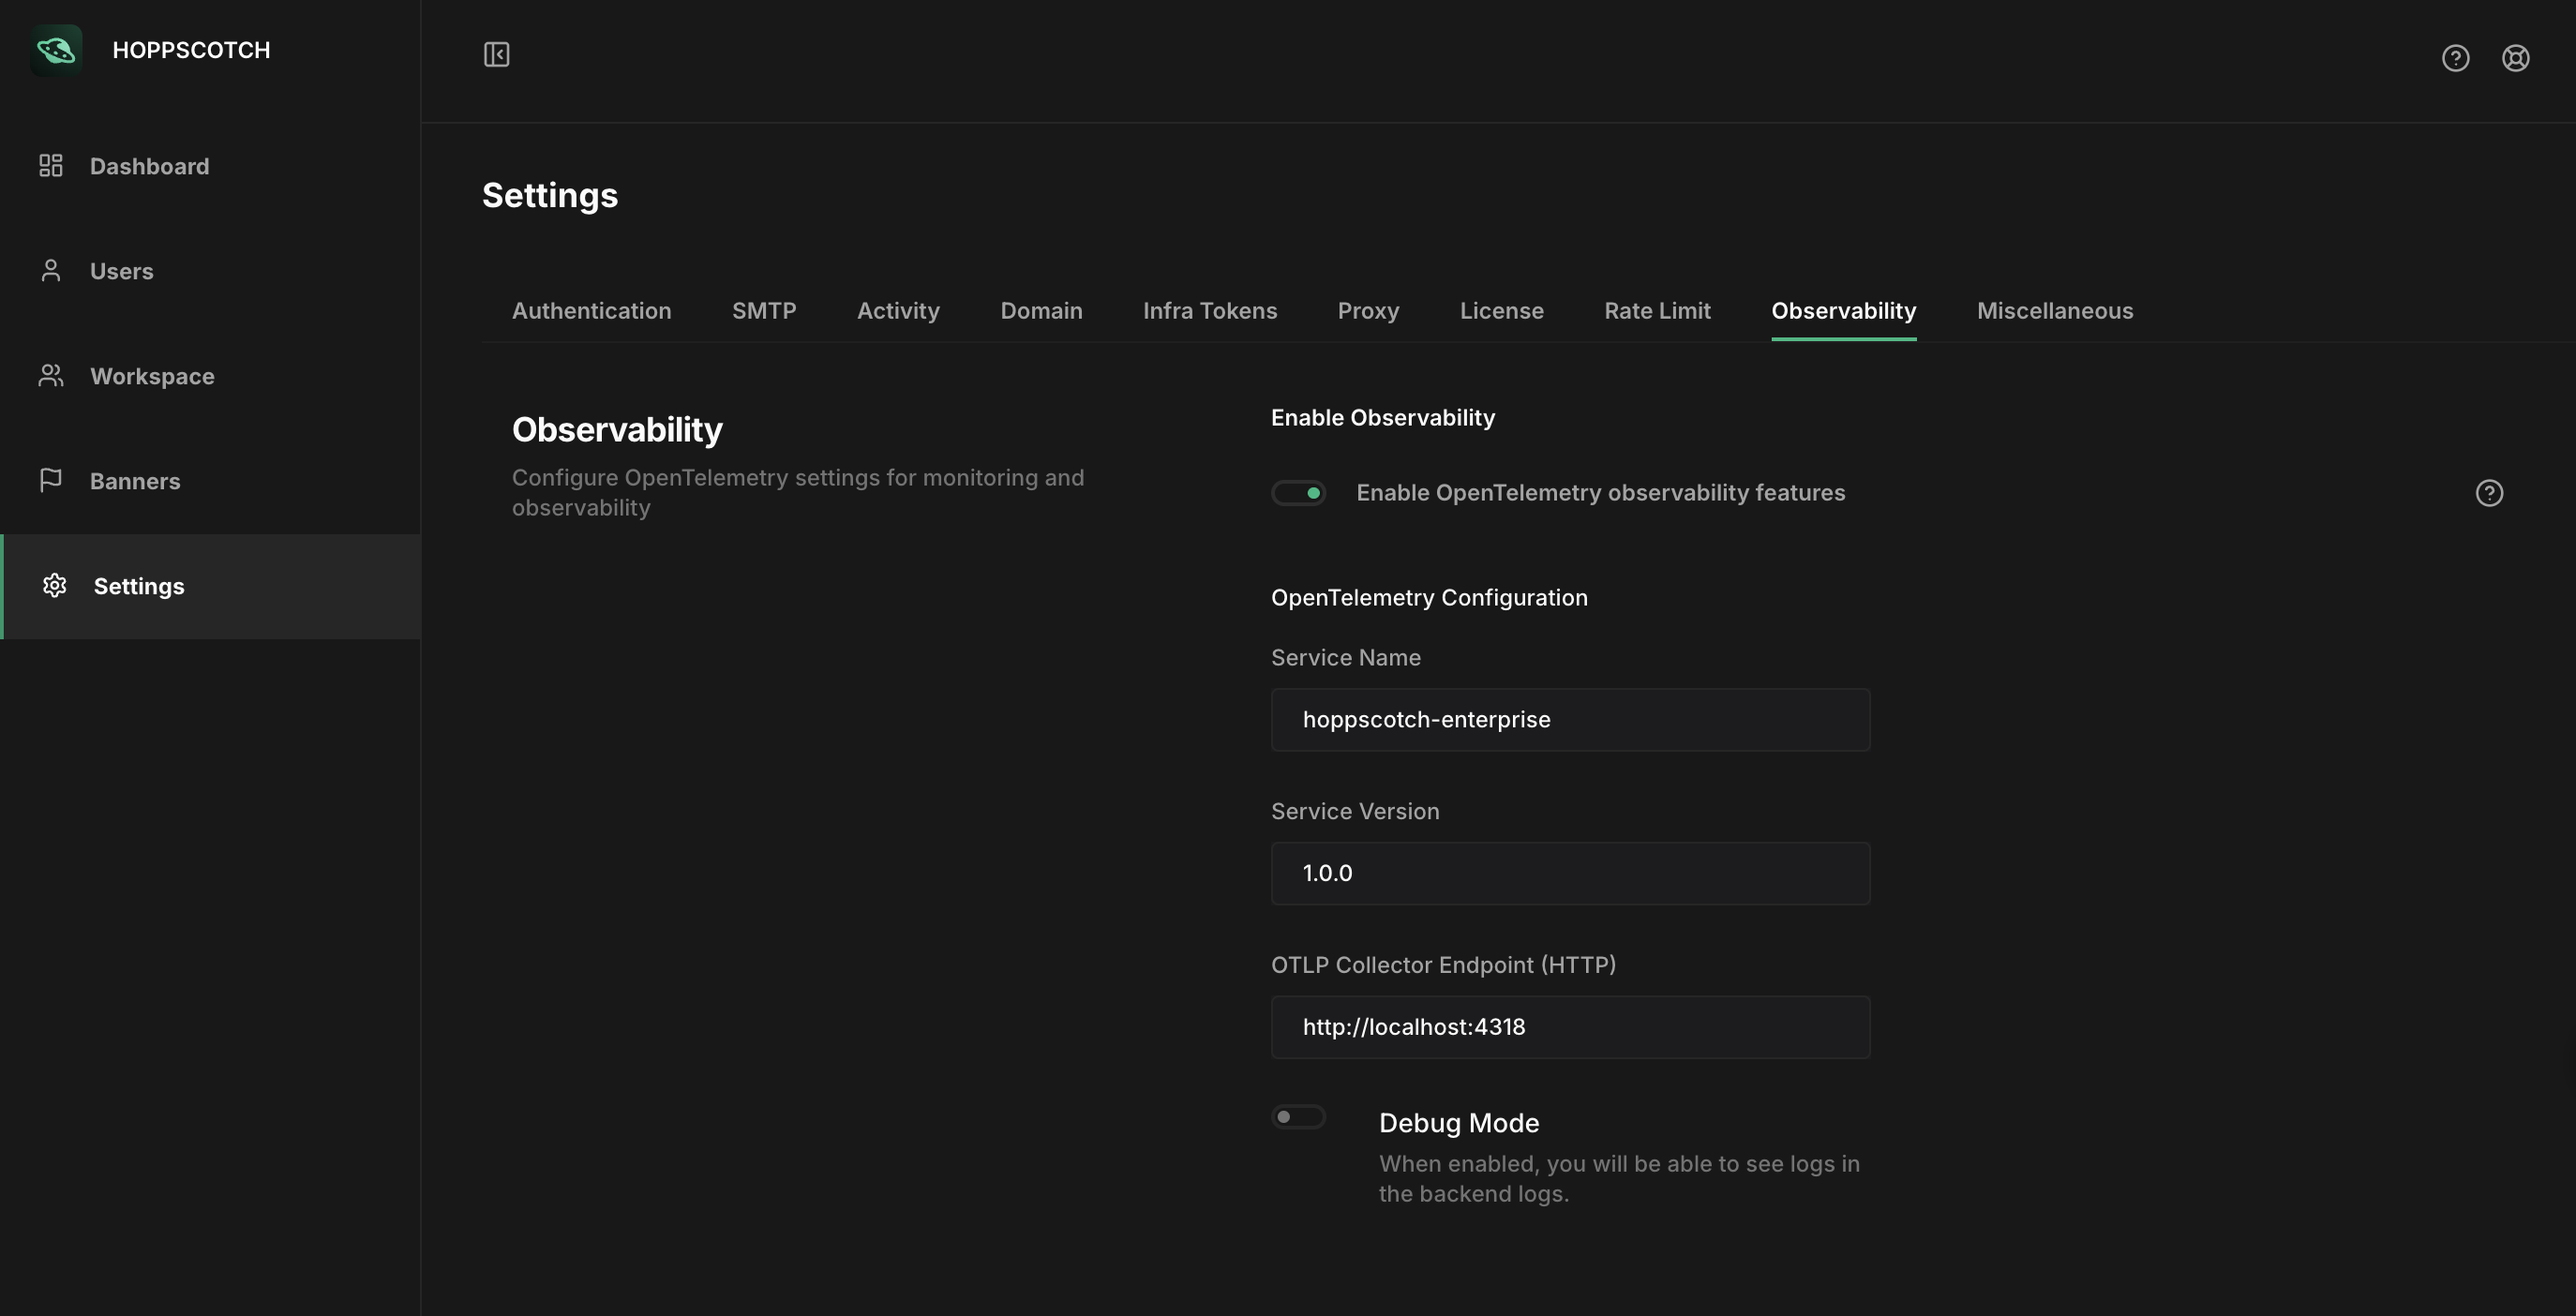
Step 6: Connect Hoppscotch
Step 6: Connect Hoppscotch
From the Hoppscotch Admin Dashboard, configure the OpenTelemetry Collector endpoint (HTTP).